Author: R&D Team, CUIGUAI Flavoring
Published by: Guangdong Unique Flavor Co., Ltd.
Last Updated: Nov 22, 2025

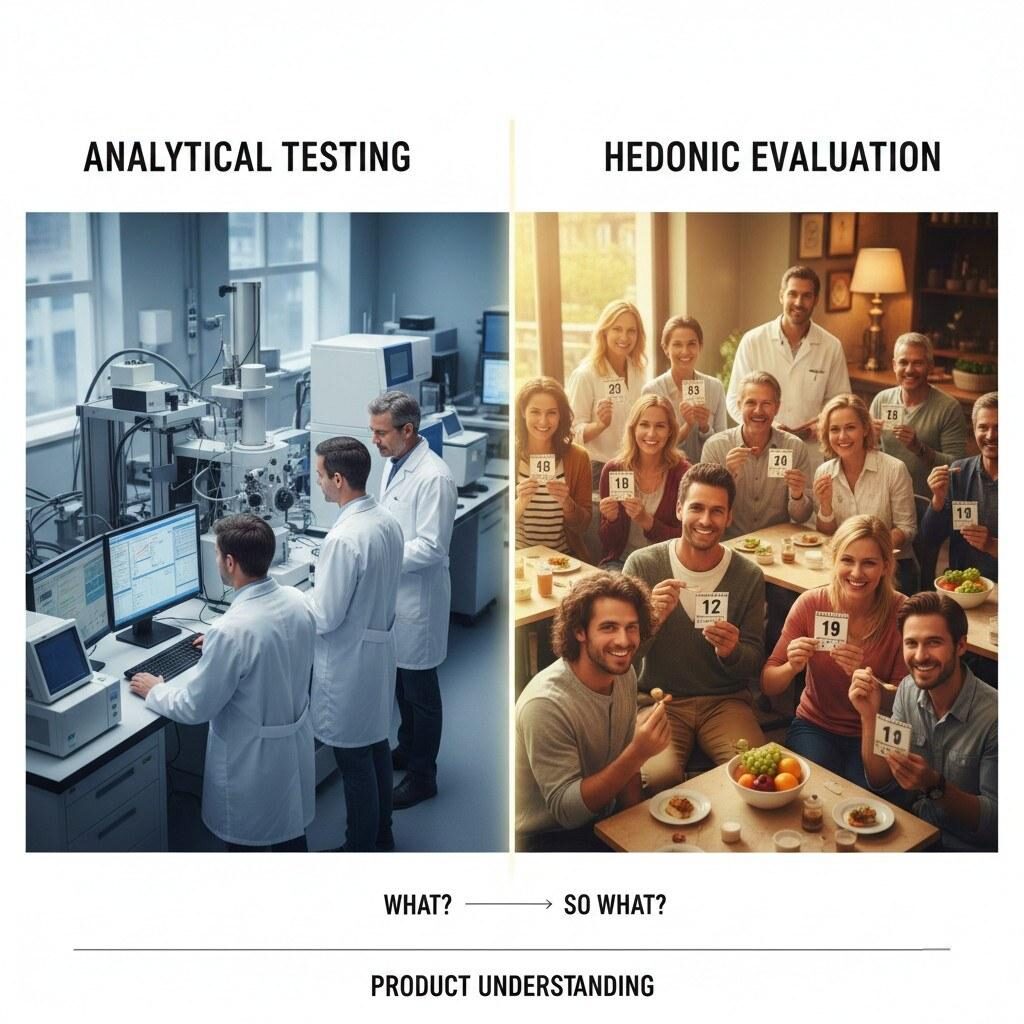
Analytical vs. Hedonic Testing
In the fiercely competitive food and beverage market, the ultimate measure of success is simple: Do consumers like your product? For professional flavor manufacturers, this seemingly simple question requires a profoundly technical and systematic answer. It moves beyond mere ingredient lists and analytical chemistry, delving into the realm of sensory science—specifically, the discipline of affective testing or hedonic evaluation.
Hedonic evaluation is not just a consumer survey; it is a critical scientific methodology designed to quantify the subjective emotional responses—the degree of liking or disliking—that consumers have toward a product’s sensory attributes. By translating personal enjoyment into quantifiable, statistical data, we gain the crucial insights needed to optimize flavor profiles, predict market acceptance, and ensure a robust return on investment for our partners. This post will serve as an authoritative guide to the principles, methodologies, advanced techniques, and strategic value of hedonic evaluation in the modern flavor industry.
Before diving into the methodology, it is essential to distinguish between the two primary branches of sensory evaluation:
Hedonic evaluation focuses entirely on the latter. It is the bridge between a flavor’s chemical composition (our expertise) and its ultimate consumer acceptance (market reality). The most critical metrics measured are Acceptance (the degree of liking) and Preference (the choice between two or more samples).
The cornerstone of virtually all hedonic testing in the food industry is the 9-Point Hedonic Scale. Developed over seventy years ago, its endurance is a testament to its effectiveness and simplicity.
The scale was initially developed in the 1950s by David Peryam and colleagues at the Quartermaster Food and Container Institute of the U.S. Armed Forces to systematically measure the food preferences of soldiers, a mission-critical objective for troop morale and performance [Citation 1: Peryam, D. R., and Pilgrim, F. J. (1957). Hedonic scale method of measuring food preferences. Food Technology]. Its structure is a bipolar, balanced category scale with nine verbal anchors:
| Score | Verbal Anchor | Emotional State |
| 9 | Like Extremely | High Acceptance |
| 8 | Like Very Much | |
| 7 | Like Moderately | |
| 6 | Like Slightly | |
| 5 | Neither Like nor Dislike | Neutrality |
| 4 | Dislike Slightly | |
| 3 | Dislike Moderately | |
| 2 | Dislike Very Much | |
| 1 | Dislike Extremely | High Rejection |
The scale’s odd number of points ensures a central neutral point (5), which is crucial for distinguishing between indifference and active dislike. The key assumption in analyzing the data is that the psychological distance between successive verbal anchors is approximately equal, justifying the use of parametric statistical analysis (such as ANOVA and t-tests) on the integer scores.
While widely used and effective, the mathematical treatment of the 9-point scale data is a point of ongoing technical discussion within sensory science. Critics argue that human perception may not treat the intervals equally; for example, the psychological distance between “Like Extremely” (9) and “Like Very Much” (8) may not be the same as the distance between “Neither Like nor Dislike” (5) and “Dislike Slightly” (4).
Consequently, researchers often treat data obtained with the 9-point scale as if the numbers assigned to the categories were points on a continuum, despite the fact that its categorical structure technically yields ordinal- or at best, interval-level data [Citation 2: Stone, H. & Sidel, J. L. (2004). Sensory Evaluation Practices (3rd ed.). Academic Press]. This debate underpins the importance of having a large, representative sample size to mitigate individual variability and justify the parametric analysis required for powerful statistical conclusions.
To address specific research needs and limitations, several variations of the traditional scale exist:
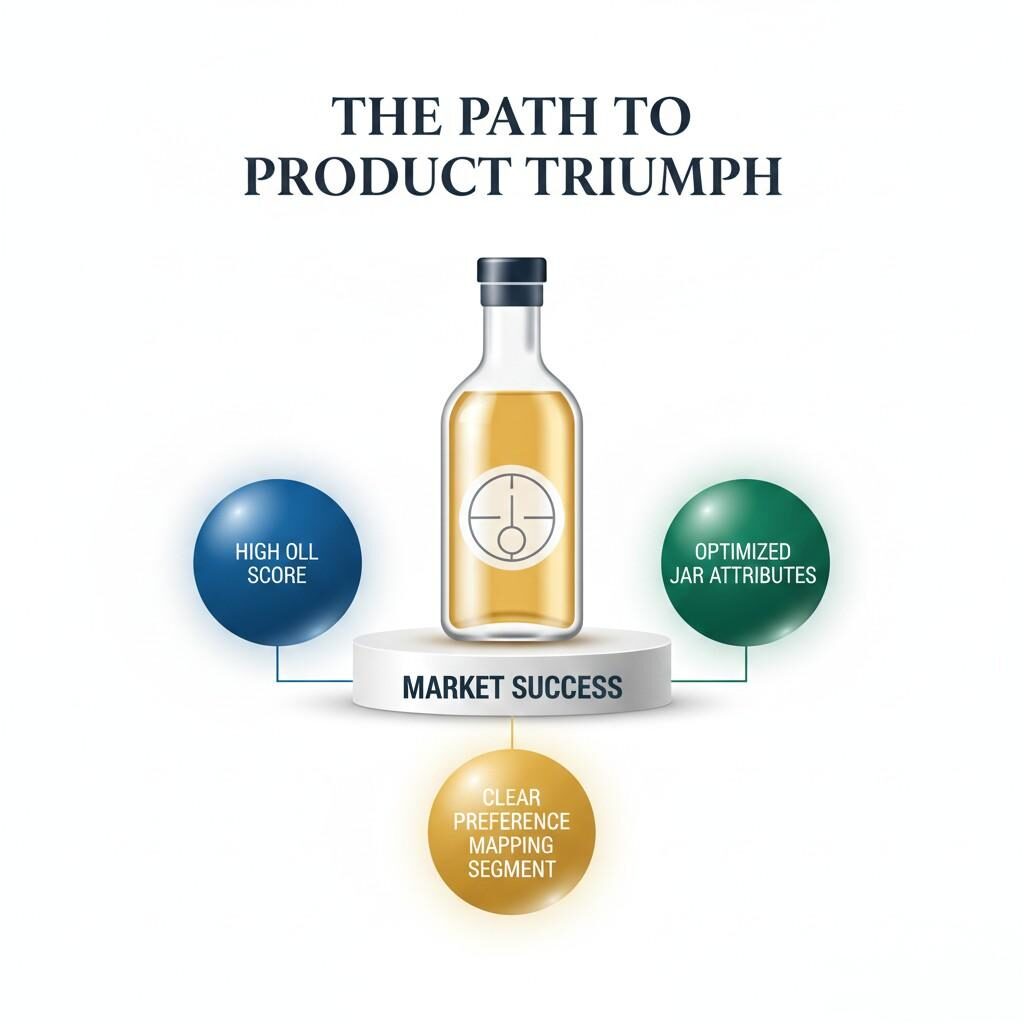
A high score on the 9-point scale for Overall Liking (OLL) is the primary goal, but modern flavor development requires a deeper understanding of why a product is liked or disliked. This is achieved by combining the OLL score with other crucial affective tests.
The Just-About-Right (JAR) Scale is an indispensable tool for flavor optimization. Instead of asking how much a consumer likes a specific attribute (e.g., sweetness), it asks about the intensity of that attribute relative to their ideal:
$$\text{Too Little (1) – Just Right (3) – Too Much (5)}$$
When a product receives a high OLL score but a specific attribute (like the vanilla note or the level of sourness) is rated as “Too Little” or “Too Much” by a significant portion of the consumers, it signals a direct path for formulation adjustment [Citation 3: Civille, G. V., & Heymann, H. (2017). Sensory Evaluation Techniques (5th ed.). CRC Press].
Practical Application for Flavorists: JAR data allows us to precisely target the intensity of a flavor compound. If a new Strawberry-Kiwi beverage flavor receives high OLL but 30% of consumers rate the kiwi flavor intensity as “Too Little,” our flavorists know exactly where to focus—not on changing the fundamental flavor profile, but on modulating the intensity of the kiwi character. The goal is to maximize the “Just Right” percentage.
For a flavor to be commercially viable, liking must translate into buying. Hedonic tests are nearly always paired with Purchase Intent (PI) Scales.
Action Standards are pre-defined thresholds that determine a flavor’s readiness for market. A common standard requires:
Meeting these statistical thresholds provides the necessary confidence to proceed with costly market launch or full-scale production.

JAR Scores & OLL Relationship
The most profound insights in flavor development come from combining the “What” (Descriptive) with the “How Much” (Hedonic). This is the foundation of Preference Mapping.
Preference mapping is a suite of statistical techniques that visually represents the relationship between the sensory characteristics of a set of samples (flavor profiles) and consumer liking scores.
This integrated approach answers the crucial question: Which specific sensory attributes drive consumer liking or rejection? If a new “Bold Citrus” flavor is rejected, preference mapping might reveal that the rejection is not due to the citrus character itself, but to a perceived “Astringency” note that is too intense. This steers the flavorist away from modifying the core flavor and toward using a masking or modulating agent.
Advanced hedonic evaluation now incorporates cognitive and emotional metrics, acknowledging that liking is more than just a sum of sensory inputs.
Furthermore, a study exploring the success of novel food combinations found that consumer evaluations are influenced by a combination of perceptual (balance of intensity), conceptual (norms), and affective (surprise) pairing principles, highlighting the power of cognitive factors and expectations in flavor acceptance [Citation 4: Zampini, M., & Spence, C. (2020). What makes foods and flavours fit? Consumer perception of (un)usual product combinations. Food Quality and Preference]. This emphasizes that our work extends beyond chemistry to include the story and concept of the flavor.
The reliability of hedonic data hinges on meticulous execution of the testing protocol. Even the best flavor profile can be sabotaged by poor testing procedure.
To isolate the flavor stimulus, the testing environment must be as neutral and controlled as possible:
While the mean score provides a quick snapshot, a full analysis requires:
For our clients and partners, hedonic evaluation is the essential tool that de-risks product development and maximizes market potential.
Flavor is the single most important driver of repurchase intent. By using hedonic testing to ensure a product meets or exceeds the acceptance level of benchmark market leaders, we effectively lower the risk of expensive product failures. It moves the decision process from subjective opinion to objective data.
Hedonic mapping informs decisions about flavor portfolio expansion. By identifying distinct consumer segments (internal preference mapping), a company can strategically launch flavors that target an unmet need or segment, avoiding cannibalization of their existing top-selling products.
In global markets, hedonic testing is crucial for localization. What is “Like Extremely” in one region (e.g., intense sourness) may be “Dislike Moderately” in another. Hedonic scales are often adapted, using localized language or non-verbal scales, to ensure accurate measurement of acceptance across diverse cultural palates.
When ingredient costs rise or health regulations demand a change (e.g., sodium reduction, sugar removal), hedonic testing provides the objective proof that the reformulated flavor remains “parity” (equally liked) or “preferred” over the original or the competitive benchmark. This ensures cost savings or formulation compliance without sacrificing consumer acceptance.
The journey from a complex chemical mixture to a flavor that inspires consumer delight is guided by the rigor of sensory science. Hedonic evaluation, anchored by the foundational 9-point scale and enhanced by advanced techniques like JAR scales and Preference Mapping, provides the essential data to navigate this journey. It is the language of consumer acceptance—a quantifiable measure of pleasure that transforms subjective enjoyment into objective, actionable business intelligence. For a flavor to succeed, it must not just be technically sound; it must be profoundly liked. By committing to comprehensive hedonic testing, we empower our partners to not just compete, but to capture the hearts and palates of consumers worldwide.

Product Triumph Path
Ready to quantify consumer delight and de-risk your next product launch? Partner with our flavor scientists to utilize our state-of-the-art sensory analysis facilities. Contact our technical exchange team today for a detailed consultation, or request a free sample of a custom-developed flavor profile tailored to exceed your target market’s hedonic standards.
📧 Email: [info@cuiguai.com]
🌐 Website: [www.cuiguai.cn]
📱 WhatsApp: [+86 189 2926 7983]
☎ Phone: [+86 0769 8838 0789]
Copyright © 2025 Guangdong Unique Flavor Co., Ltd. All Rights Reserved.